Initial Interest
A few days ago (the day after World Emoji Day as it happens) I discovered a tweet:
Y’all know what to do https://t.co/YCRHtJfWAk
— Lucy Davinhart (@LucyDavinhart) 18 July 2018
Apparently there’s a bot keeping track of which emojis get the most use. It’s made by Jeremy Schmidt and is called, fittingly, LeastUsedEmojiBot. You can find the code on GitHub
As a fan of emojis in general, this got me interested. Obviously I wanted to try to help the humble Aerial Tramway emoji reach its true potential of second least used emoji on Twitter.
As
To keep track, we are on 128916 at the moment. 🚡
— Lucy Davinhart (@LucyDavinhart) 18 July 2018
You
And I think it only counts number of tweets it’s used in, rather than number of uses.
— Lucy Davinhart (@LucyDavinhart) 18 July 2018
It does appear to update pretty dam quick.
🚡🚡🚡🚡🚡🚡🚡🚡🚡🚡
May
Yep. One per tweet. 🚡
— Lucy Davinhart (@LucyDavinhart) 18 July 2018
Have
Also, nice.
— Lucy Davinhart (@LucyDavinhart) 18 July 2018
🚡 https://t.co/gE9CpRsIdb
Noticed
Me: *slaps twitter*
— Lucy Davinhart (@LucyDavinhart) 18 July 2018
This baby can hold so many 🚡🚡🚡🚡🚡🚡🚡🚡🚡🚡🚡🚡🚡🚡🚡🚡🚡🚡🚡🚡🚡🚡🚡🚡🚡🚡🚡🚡🚡🚡🚡🚡🚡🚡🚡🚡🚡🚡🚡🚡🚡🚡🚡🚡🚡🚡🚡🚡🚡🚡🚡🚡🚡🚡🚡🚡🚡🚡🚡🚡🚡🚡🚡🚡🚡🚡🚡🚡🚡🚡🚡🚡🚡🚡🚡🚡🚡🚡🚡🚡🚡🚡🚡🚡🚡🚡🚡🚡🚡🚡🚡🚡🚡🚡🚡🚡🚡🚡🚡🚡🚡🚡🚡🚡🚡🚡🚡🚡🚡🚡🚡🚡🚡🚡🚡🚡
Digging into this further, I found that the bot got its data from a site called Emojitracker, made by Matthew Rothenberg
![]()
This site gets realtime updates from the Twitter Streaming API of all emojis used on Twitter.
That’s a LOT of data, and some nice APIs too:
There’s a REST API, to get a snapshot of all emojis, and a Streaming API for updates.
Now I was even more interested.

Writing a Prometheus Exporter
It was at this point that I noticed that usage of the Aerial Tramway emoji was increasing faster than its rival, the Input Symbol for Latin Capital Letters. This was almost certainly due to LeastUsedEmojiBot highlighting it. At some point it would overtake, but I wasn’t sure how soon.
It was now Friday afternoon. At work, we have a thing called “Learning and Development Time”, in which you can (within reason) basically do whatever you like to further your personal development. It doesn’t even have to be work related. In the past, I’ve used this time to work on various personal dev projects, which I may blog about at some point.
One of those previous projects was a Prometheus Exporter for Twitch.tv. My wife is a Twitch streamer (obligatory plug: SeraphimKimiko), and I’m a nerd, so I wanted to keep track of how many people were watching her live. So I made this, written in Go, consuming the Twitch APIs, and exporting them as Prometheus metrics. I included a Docker Compose file to spin up the Prometheus exporter, a Prometheus server to scrape it, and a pre-configured Grafana instance to draw pretty pretty graphs. And it’s written in Go. Because of course it is.
Thanks to that project, I had most of the code already to graph data from the Emojitracker APIs. I got to work on what would eventually become my Prometheus Exporter for Twitter Emojis.
Let’s see what the Emojitracker API gives us. The API endpoint I’m interested in is https://api.emojitracker.com/v1/rankings, which returns JSON like:
$ curl -s https://api.emojitracker.com/v1/rankings | jq .
[

...

  {
    "char": "🚡",
    "id": "1F6A1",
    "name": "AERIAL TRAMWAY",
    "score": 130982
  },
  {
    "char": "🔠",
    "id": "1F520",
    "name": "INPUT SYMBOL FOR LATIN CAPITAL LETTERS",
    "score": 130893
  }
]
First, we need a Prometheus metric. I used a Gauge (which, in Prometheus is a metric which can go up or down). Arguably I should have used a Counter (which can only go up), but this was a proof of concept, and I wasn’t sure what happens if tweets get deleted. I’m interested in the emoji itself (because apparently both Prometheus and Grafana support those just fine), as well as some plaintext identifiers:
emojiScore = prometheus.NewGaugeVec(
  prometheus.GaugeOpts{
    Namespace: "lmhd",
    Subsystem: "emoji",
    Name:      "twitter_ranking",
    Help:      "Number of uses of this emoji on twitter",
  },
  []string{
    // Which emoji?
    "emoji",
    "name",
    "id",
  },
)
Now we need to populate that with some data.
I used json-to-go to quickly generate a type which matched the output of the API:
type EmojiRankingsResponse []struct {
  Char  string `json:"char"`
  ID    string `json:"id"`
  Name  string `json:"name"`
  Score int    `json:"score"`
}
For my Twitch exporter, I had used curl-to-go to generate some Go code to call the APIs, and return structs. The code my Emoji exporter used was based off that.
There are two functions here. The first calls the API, and returns (among other things) the response body:
func EmojiRankingsRequest() ([]byte, *http.Response, error) {
  // Modified from code generated by curl-to-Go: https://mholt.github.io/curl-to-go

  url := "https://api.emojitracker.com/v1/rankings"

  req, err := http.NewRequest("GET", url, nil)
  if err != nil {
    log.WithFields(log.Fields{"url": url}).Errorf("%s", err)
    return []byte{}, nil, err
  }

  resp, err := http.DefaultClient.Do(req)
  if err != nil {
    log.WithFields(log.Fields{"url": url}).Errorf("%s", err)
    return []byte{}, resp, err
  }
  defer resp.Body.Close()

  body, err := ioutil.ReadAll(resp.Body)
  if err != nil {
    log.WithFields(log.Fields{"url": url}).Errorf("%s", err)
    return []byte{}, resp, err
  }

  return body, resp, nil
}
The second takes that response and converts it into something of type EmojiRankingsResponse.
func Rankings() (EmojiRankingsResponse, error) {

  // init an empty response
  response := EmojiRankingsResponse{}

  // body, resp, err
  body, resp, err := EmojiRankingsRequest()
  if err != nil {
    log.Errorf("%s", err)
    return response, err
  }
  if resp.StatusCode != 200 {
    log.Errorf("Error code %s, Error: %s", resp.StatusCode, err)
    return response, err
  }

  err = json.Unmarshal(body, &response)
  if err != nil {
    log.Errorf("%s", err)
    return response, err
  }

  return response, nil
}
You can find this in emoji.go
So with that in place, I can populate my Prometheus metrics. In my main.go, I iterate through all emojis in that response, and update their corresponding Prometheus metric:
// Init with rest API
rankings, err := Rankings()
if err != nil {
  log.Fatalf("%s", err)
}

for _, emoji := range rankings {
  emojiScore.With(prometheus.Labels{
    "emoji": emoji.Char,
    "name":  emoji.Name,
    "id":    emoji.ID,
  }).Set(float64(emoji.Score))
}
This worked great! I now had some metrics!
$ curl -s http://localhost:8080/metrics | grep -i strawberry
lmhd_emoji_twitter_ranking{emoji="🍓",id="1F353",name="STRAWBERRY"} 9.273592e+06
But these were static, which is not much use to me. I needed updates.
As a proof of concept, I initially just called the REST API every minute for updates, and updated the prometheus metrics accordingly. But this was me being lazy. The REST API Documentation says you should not do this:
When to use the REST API
In general, use the REST API to build an initial snapshot state for a page (or get a one-time use data grab), but then use the [Streaming API][https://github.com/emojitracker/emojitrack-streamer-spec] to keep it up to date.
Do not repeatedly poll the REST API. It is intentionally aggressively cached in such a way to discourage this, in that the scores will only update at a lower rate (a few times per minute), meaning you have to use the Streaming API to get fast realtime data updates.
🚨 IN OTHER WORDS, IF YOU ARE POLLING FREQUENTLY FOR UPDATES, YOU ARE DOING SOMETHING WRONG AND YOU ARE A BAD PERSON. 🚨
(Note that this is a design decision, not a server performance issue.)
I’d never used a streaming API before, so didn’t know what to expect.
According to the documentation, I could expect:
a JSON blob every 17ms (1/60th of a second) containing the unicode IDs that have incremented and the amount they have incremented during that period.
Example:
data:{'1F4C2':2,'2665':3,'2664':1,'1F65C':1}
I curl’d the API, to see what this looks like, and wow that updates quick!
Looks a bit like this:
$ curl -s https://stream.emojitracker.com/subscribe/eps
data:{"1F405":1,"1F60C":1}

data:{"1F450":1,"1F493":1,"1F498":1,"1F602":1,"1F60D":1,"1F629":1,"25B6":1,"26BD":1}

data:{"1F64F":1}

data:{"1F60F":1,"267B":1}

data:{"1F308":1,"1F4F2":1,"1F602":2,"1F61C":1,"1F64B":1,"2B50":1}

data:{"1F607":1}

data:{"1F335":1,"1F3A5":1,"1F447":1,"1F4F2":1,"1F51E":1,"263A":1,"2705":1}

data:{"1F602":2,"2764":1}

data:{"1F621":1}

data:{"1F48F":1,"1F602":1}
So I needed to consume that URL, look for lines beginning with data:, and parse the JSON into something useful.
First thing was to just keep reading the API:
resp, _ := http.Get("https://stream.emojitracker.com/subscribe/eps")

reader := bufio.NewReader(resp.Body)
for {
  line, _ := reader.ReadBytes('\n')
  lineString := string(line)

...

}
We only care about lines which begin with data:, so let’s get those (and drop the data: prefix):
// Lines look like
// data:{"1F449":1,"1F44D":1,"1F60F":1,"26F3":1}

if strings.HasPrefix(lineString, "data:") {

  data := []byte(strings.TrimPrefix(lineString, "data:"))

  ...

}
The JSON itself is a series of string keys, with integer values. In Go that could be represented as: map[string]int.
I wasn’t sure if Go would let me parse the JSON directly into something like that, but I gave it a try:
jsonMap := make(map[string]int)
err = json.Unmarshal(data, &jsonMap)
if err != nil {
  panic(err)
}
Sure enough, it worked! It might error at some point, but like I say, proof of concept.
All that was left was to update my metrics. I used the rankings object I created earlier to lookup the name and emoji for the ID, and used that to increment my prometheus metric:
for key, val := range jsonMap {
  for _, emoji := range rankings {
    if emoji.ID == key {
      emojiScore.With(prometheus.Labels{
        "emoji": emoji.Char,
        "name":  emoji.Name,
        "id":    emoji.ID,
      }).Add(float64(val))
      log.Debugf("Char: %s (%s) : %d", key, emoji.Name, val)
    }
  }
}
And that’s basically it. It could absolutely do with some tidyup (for example, being able to lookup the emoji details from the ID, without having to iterate over rankings), but it works fine for my proof of concept.
Now, let’s get this into pretty pretty graphs.
Pretty Pretty Graphs
I went through a few iterations of this, before I settled on one I liked:
Potentially relevant to @nocturnalBadger's interests.
— Lucy Davinhart (@LucyDavinhart) 21 July 2018
🚡 pic.twitter.com/4ecnaHSd9p
I was predominantly interested in the bottom two emojis, so my dashboard kept track of those two.
I had the overall usage in a Graph panel.
This used Prometheus’ “Bottom K” operator, which I used to filter out only the bottom 10 metrics):
bottomk(10,lmhd_emoji_twitter_ranking)
I also had indvidual Singlestat panels for the two emojis, configured for example with:
lmhd_emoji_twitter_ranking{emoji="🚡"}
I left this running overnight to gather some data, then woke up this morning to discover that, oh no! Disaster struck!
Turns out, at some point in the night my prometheus exporter had stopped consuming the streaming API!
time="2018-07-22T01:43:49Z" level=debug msg="Char: 1F694 (ONCOMING POLICE CAR) : 1"
time="2018-07-22T01:43:49Z" level=debug msg="Char: 203C (DOUBLE EXCLAMATION MARK) : 1"
time="2018-07-22T01:43:49Z" level=debug msg="Char: 267B (BLACK UNIVERSAL RECYCLING SYMBOL) : 1"
time="2018-07-22T01:43:49Z" level=debug msg="Char: 2764 (HEAVY BLACK HEART) : 2"
time="2018-07-22T01:43:49Z" level=debug msg="Char: 1F618 (FACE THROWING A KISS) : 1"
time="2018-07-22T01:43:49Z" level=debug msg="Char: 1F629 (WEARY FACE) : 1"
time="2018-07-22T01:43:49Z" level=debug msg="Char: 1F494 (BROKEN HEART) : 1"
time="2018-07-22T01:43:49Z" level=debug msg="Char: 1F602 (FACE WITH TEARS OF JOY) : 2"
time="2018-07-22T01:43:49Z" level=debug msg="Char: 1F614 (PENSIVE FACE) : 1"
My numbers were stale!
Fortunately, 🚡 had not yet overtaken 🔠, so there was still time for me to see it happen.
One quick docker restart emoji_exporter_emoji_exporter_1 and we were collecting data again.
Gave my Prometheus exporter a restart, and new data is coming in.
— Lucy Davinhart (@LucyDavinhart) 22 July 2018
🚡 has certainly made quite a bit of progress since this morning, but the other one has too.
They're close. Shouldn't be long now. pic.twitter.com/zTuUhuRe3n
I kept watch, and just 20 minutes later, we did it!
So, now that 🚡 is the second least used emoji on Twitter, I'm not sure what will happen now.
— Lucy Davinhart (@LucyDavinhart) 22 July 2018
Some people will continue to tweet, as @leastUsedEmoji will not have updated yet. I believe it's scheduled to update within 25m.
At that point... I'm expecting a massive spike. pic.twitter.com/nTreFd95BH
This is the tweet which pushed 🚡 into second least used!
— Lucy Davinhart (@LucyDavinhart) 22 July 2018
YAY! https://t.co/iVhWOjnGoY
Celebrations all round!
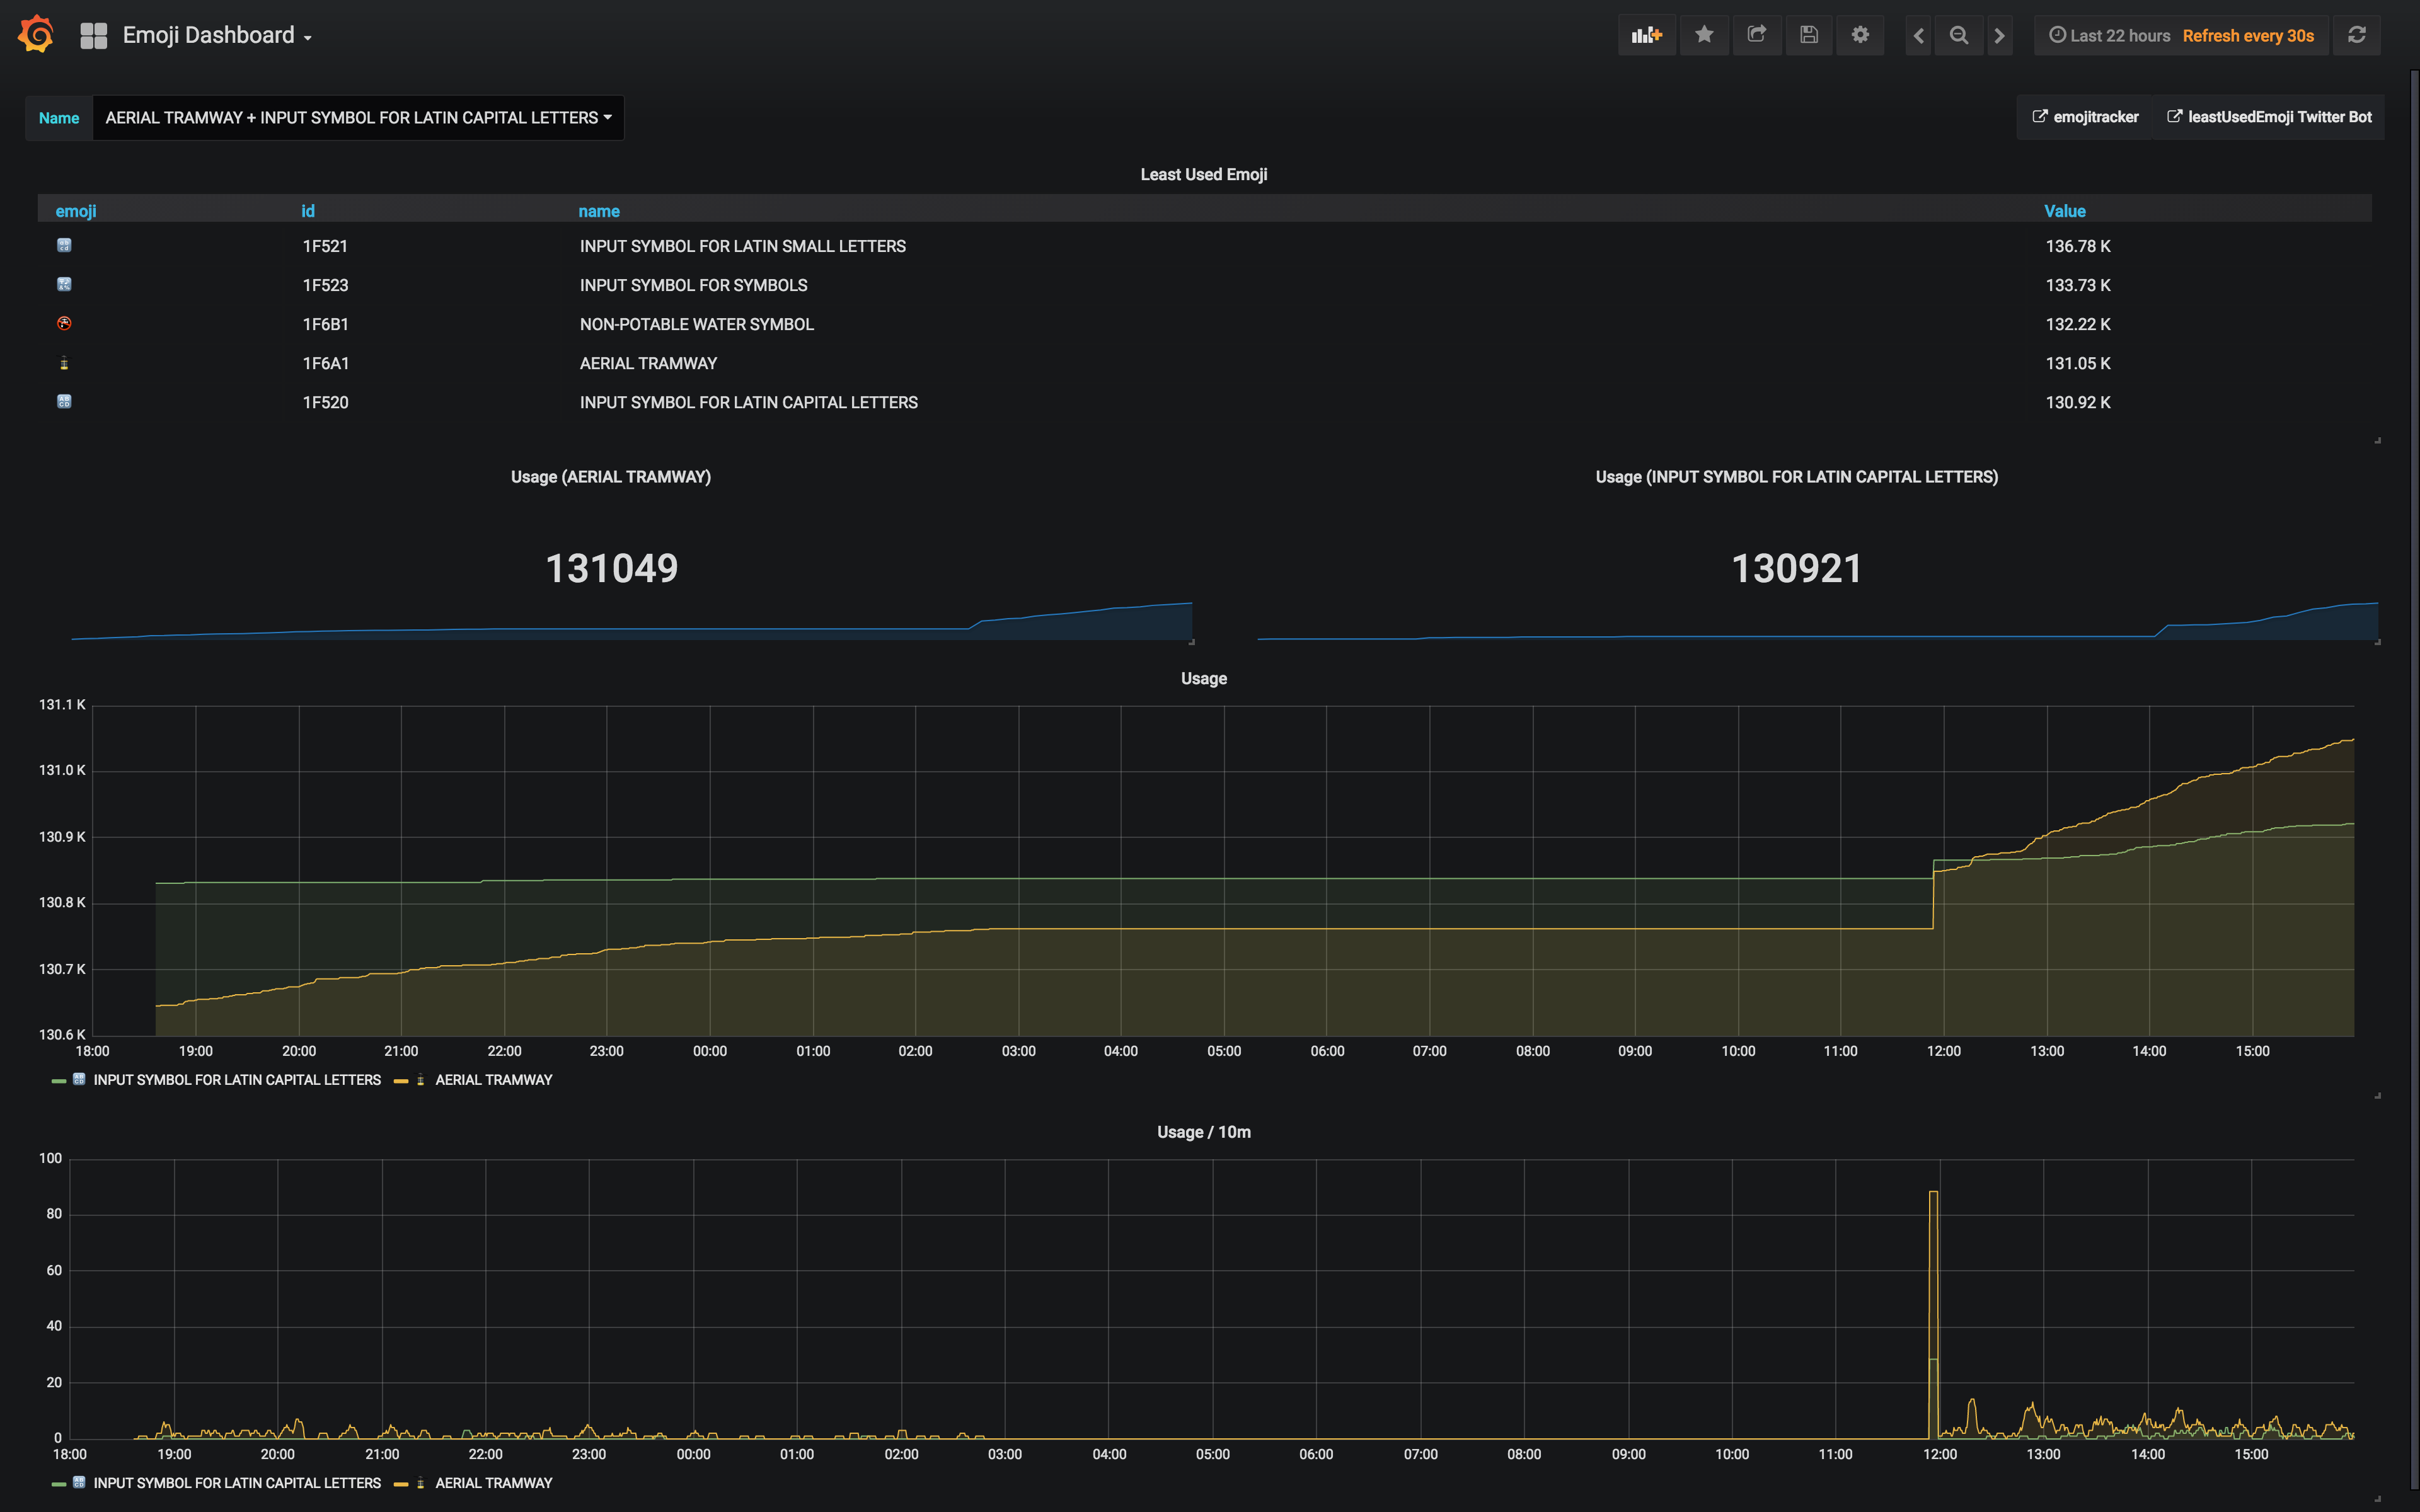
I made a couple of tweaks to the dashboard following that. The new version includes a dropdown, so you can select which emojis you want to compare (from all of them); a table, showing specifically the bottom 5 emojis; and a rate graph, showing how many individual tweets there were over a time interval of 10 minutes.
I've updated the grafana dashboard slightly, if anyone is still interested.
— Lucy Davinhart (@LucyDavinhart) 22 July 2018
🚡
Now includes a table
Code:https://t.co/2PwmnRIC6y
Interactive Snapshot:https://t.co/OT3sNW0jnY
Screenshot: pic.twitter.com/6R01KfoAQC
I've also added a rate graph, which converts the cumulative number of tweets into tweets over time (i'm using a 10 minute interval).
— Lucy Davinhart (@LucyDavinhart) 22 July 2018
Usage spikes are even more obvious in this graph. pic.twitter.com/ocbWwFtbAD
What was the point? What did I learn?
You mean I need to do stuff because it has a point?
Nah.
That’s not a thing.
Seriously though, this was a fun thing to work on, especially as I was able to re-use so much code, letting me play a bit more without figuring out how to just get something working.
I already do a lot of realtime monitoring of a bunch of stuff at work, to make sure I don’t get woken up in the middle of the night (or to ensure I definitely do, if something needs fixing). But these two things (my Twitch exporter, and my Emoji exporter) include monitoring of external APIs, and human nature.
This one in particular was fascinating. Because it was a relatively small dataset (the LeastUsedEmojiBot only has 14k followers on Twitter), I could clearly see cause and effect. For example, the spike in usage following the bot’s announcement that 🔠 was now the least used.
It was also interesting being able to make preditions, using Prometheus’ predict_linear() function:
According to my grafana dashboard, we should be overtaking Truncated Latin Alphabet some point early tomorrow. 🚡 https://t.co/w63l6lRJDv
— Lucy Davinhart (@LucyDavinhart) 21 July 2018
Using Prometheus's built in predict_linear() function, the two emoji should be approximately equal in about 9 hours (5am for me in the UK). 🚡
— Lucy Davinhart (@LucyDavinhart) 21 July 2018
Specifically by 5amhttps://t.co/RvULAuVx7y
— Lucy Davinhart (@LucyDavinhart) 21 July 2018
I was wrong, of course. Human nature is not so easily predictable by simple linear regression.
But yes. This was fun. I need to do silly things like this more often.
I’ll leave you with this video, by a very inspiring woman:
And one more graph (click on it to go to the interactive version!):